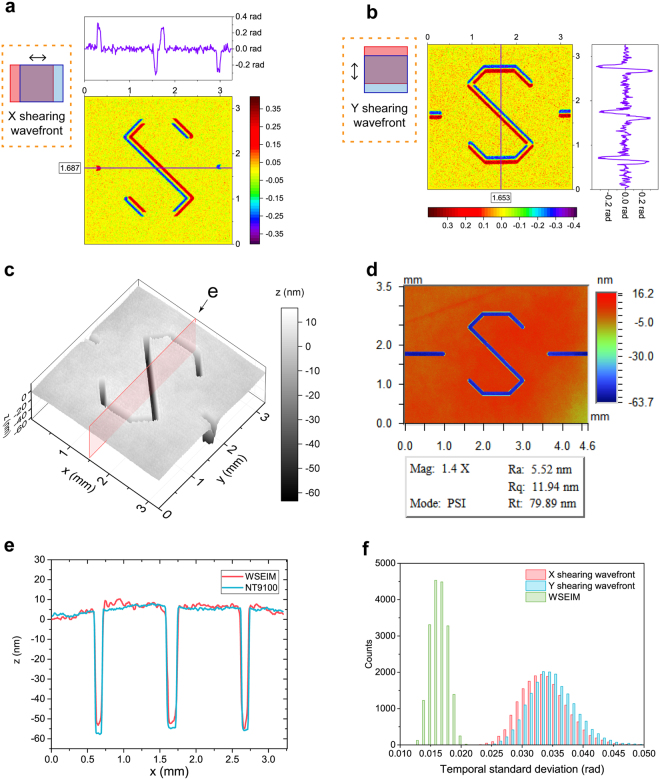
Figure 6.
Characterization of etched surface using WSEIM. (a) Shearing wavefront in the x direction. The purple line on the top shows the one-dimensional distribution along the line y = 1.687 mm in the center of the x shearing wavefront. (b) Shearing wavefront in the y direction. The purple line on the right shows the one-dimensional distribution along the line x = 1.653 mm in the center of the y shearing wavefront. Note that the amplitudes of the shearing wavefronts obtained in (a) and (b) are both 2-fold larger than that of the original wavefront. (c) Profiling result measured by our WSEIM. (d) Testing result from the Wyko NT9100 optical profiling system. (e) Comparison of the one-dimensional distribution results on the cross section labeled in (c) measured by the WSEIM and the Wyko NT9100. (f) Histogram of the temporal standard deviation of phase, the shearing wavefronts in the x and y directions are illustrated in red and blue, while the temporal standard deviation of the wavefront retrieved by WSEIM in green is only half of the temporal standard deviation of the shearing wavefronts.

