Figure 7.
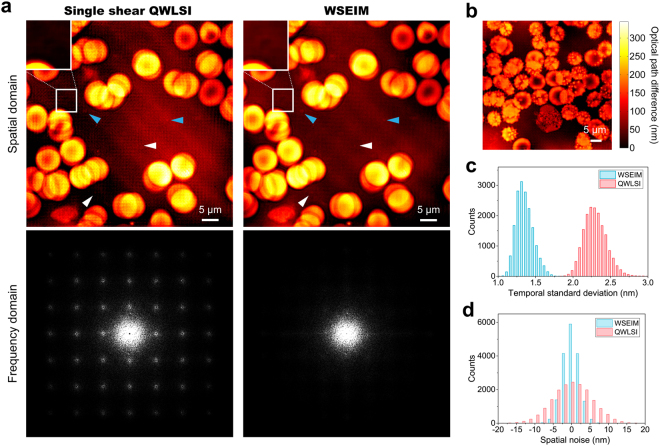
Quantitative phase imaging of RBCs using WSEIM. (a) Comparison of the phase imaging results by the single shear QWLSI and the WSEIM. Spatially periodical error emerges in the test result of the single shear QWLSI, as its corresponding Fourier spectrum also has lattice-like errors due to zero measurement sensitivities at these frequencies. Because of wideband sensitivity enhancement, these errors has been eliminated in the test result of the WSEIM. (Insets) A platelet with tiny optical path difference compared with blood plasma is observed by the WSEIM, but it is invisible in the phase image obtained by single shear QWLSI. Blue arrowheads point to the microbes shown in both phase images while white arrowheads point to the microbes only observed in the phase image obtained by the WSEIM. Full time sequence is available as Supplementary video S1. (b) Quantitative phase imaging of acanthocytes and a white blood cell to validate the robustness of DLPU algorithm. (c) The background standard deviations of the single shear QWLSI and the WSEIM in 20 seconds and (d) The spatial noises of the single shear QWLSI and the WSEIM, in which a great improvement in both temporal and spatial SNR can be observed.

