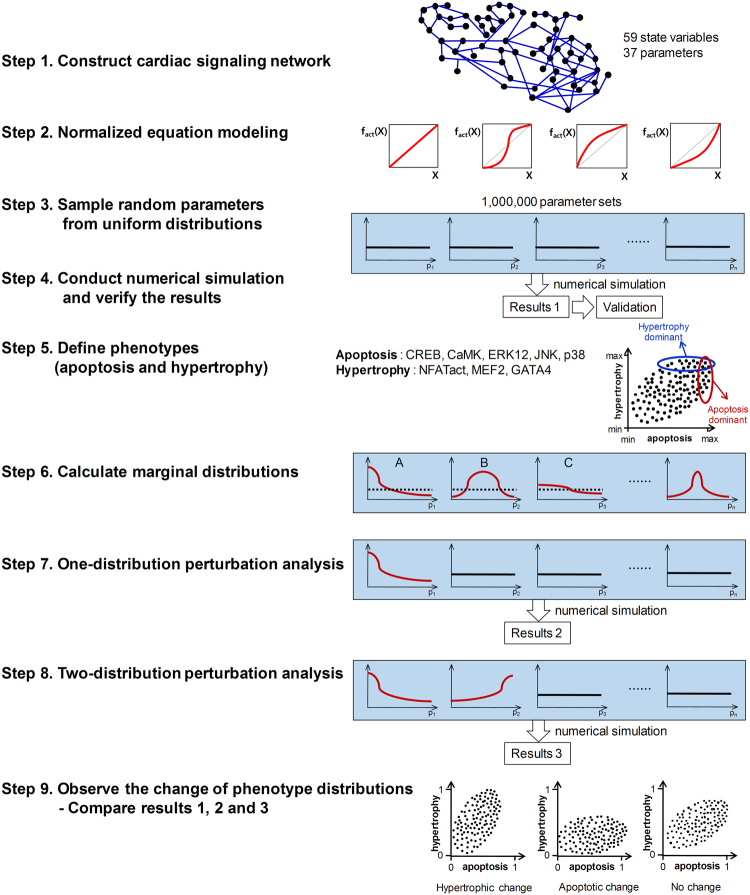
Figure 2.
Analysis workflows for the cardiac signaling network. Step 1. Construct a large-scale cardiac signaling network; Step 2. Formulate the network as a mathematical model using the normalized equation modeling method; Step 3. Generate one million random parameter sets from standard uniform distributions; Step 4. Conduct the numerical simulation using ode15s function in MATLAB and verify the model by comparing the simulation results with experimental data; Step 5. Define apoptotic and hypertrophic phenotypes; Step 6. Calculate marginal distributions of parameters that are associated with apoptotic or hypertrophic phenotypes (plot A and plot B represent non-uniform marginal distributions and plot C represents a near-uniform marginal distribution; the lines colored in red denote a marginal distribution and dotted lines denote a uniform distribution); Step 7. Perform one distribution perturbation analyses; Step 8. Perform two distribution perturbation analyses; Step 9. Observe the change of phenotype distributions by distribution perturbation analyses.

