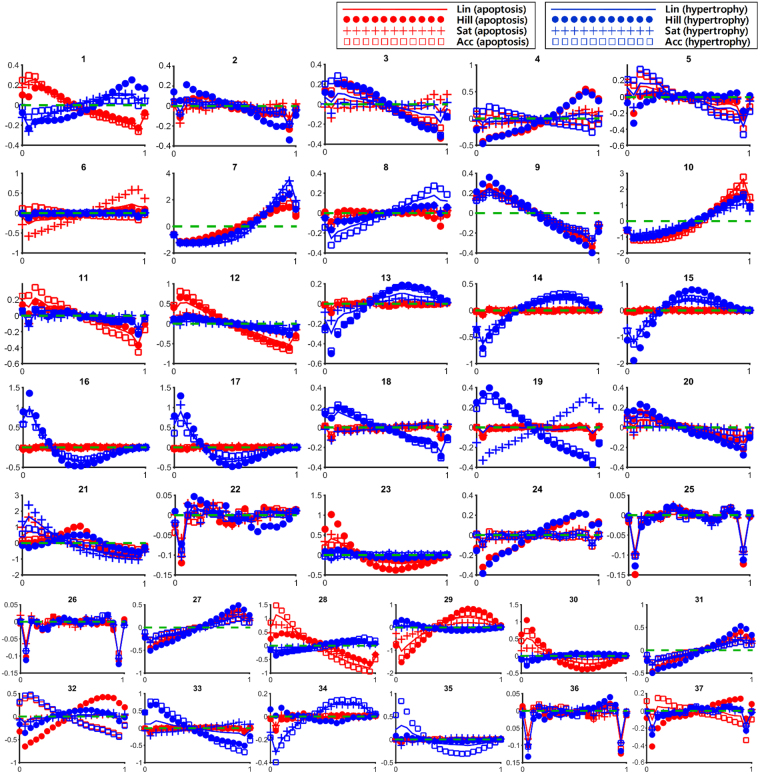
Figure 3.
Marginal distribution for apoptosis (red) and hypertrophy (blue). A green dotted line marks the same level of density between the marginal distribution and the uniform distribution. In the area above the green line, the density is higher than that of the uniform distribution, whereas in the area below the green line, the density is lower than that of the uniform distribution.

