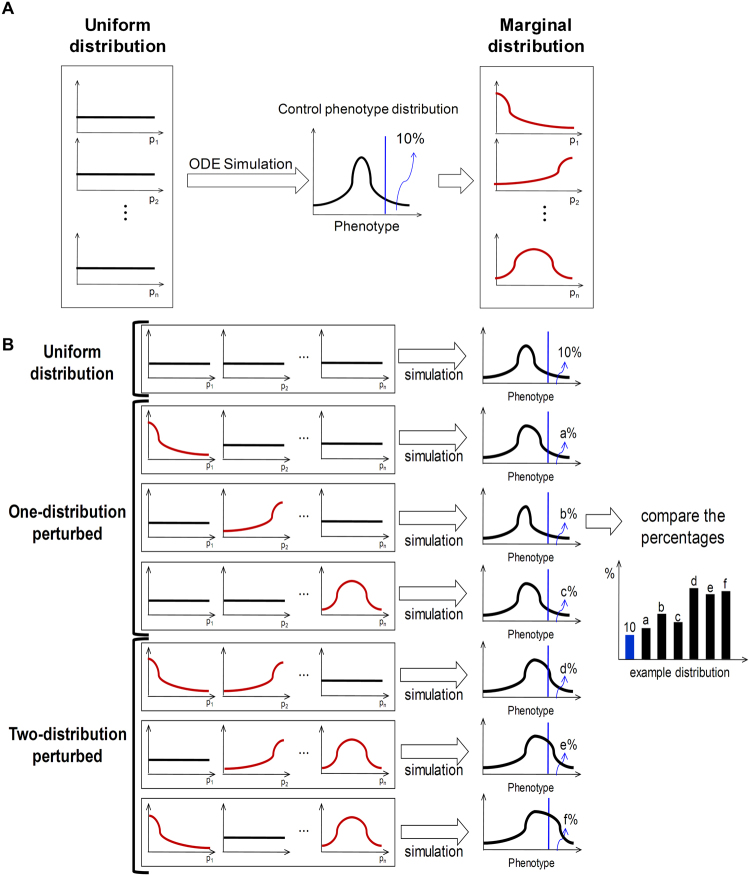
Figure 6.
Distribution perturbation analysis. (A) After an initial simulation with random parameters sampled from a uniform distribution, the marginal distribution associated with a specific phenotype is calculated. (B) After one-distribution and two-distribution perturbation analyses, the resulting phenotype distributions are compared to the control phenotype distributions.

