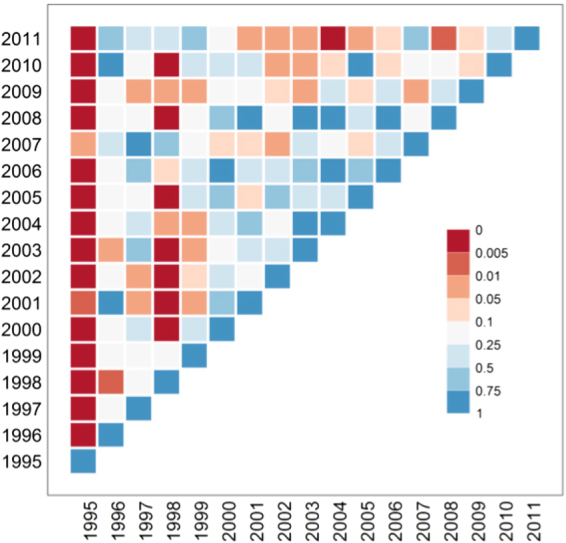
Figure 4.

Matrix of p values from Hotelling’s T2 tests. Under H0 the T2 statistic follows a central F distribution. The test is described in the Methods section. We compare the incidence rates of TB among resident Singaporeans, for planning areas of Singapore for a pairs of years. The colour red implies significant statistical difference in overall spatial risk between the two years while blue implies no difference.
