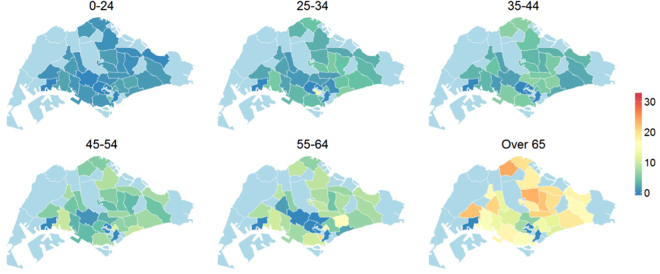
Figure 5.
Age and zonal distribution of TB among resident Singaporeans in the year 2000. The values are adjusted for the population size and expressed per 10,000 of the susceptible population. Plots were created in statistical program R22 using the package spatstat 19. Administrative and national political coordinates of Singapore were provided, for academic research and publication, by the Singapore Land Authority (SLA)24.

