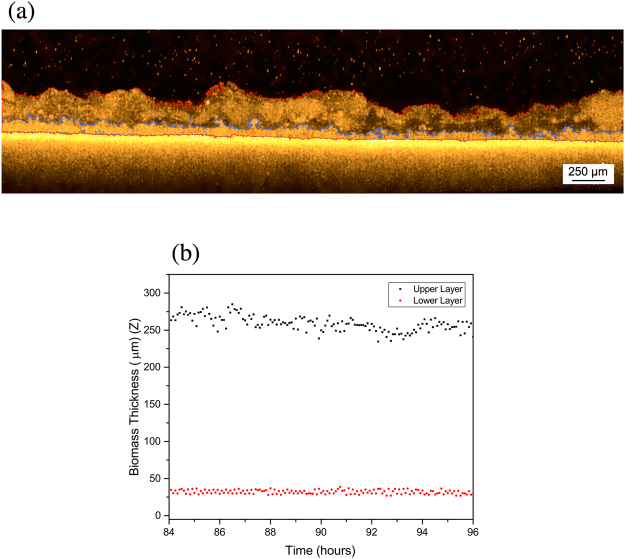
Figure 6.
(a) Morphology observed after 84 h non-destructively and directly in the filtration tank with OCT. The biofouling presents a double-layered structure. The lines in red and in blue delimit the upper and lower layer, respectively. (b) Average thickness of the double layers over the time. The structure was monitored for a period of 12 h (OCT scans acquired every 5 min) after 84 h from the beginning of the experiment.

