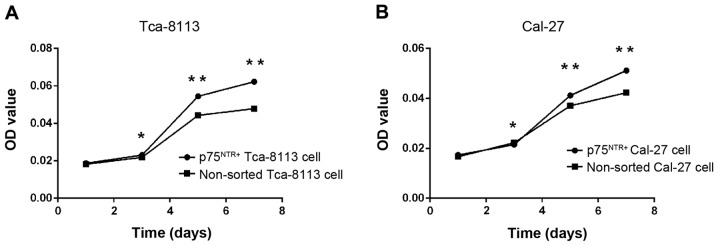
Figure 7.
Growth curves of sorted p75NTR+ cells and non-sorted cells from the (A) Tca-8113 and (B) CAL-27 tongue squamous cell carcinoma cell lines. Cell growth curves were determined using MTT assay. No differences in proliferative ability (OD values) were detected on day 1. After 3 days of culture, OD values for p75NTR+ cells were greater compared with non-sorted cells (*P<0.05), indicating stronger proliferative ability of p75NTR+ cells in vitro. Proliferation was increased on days 5 and 7 (**P<0.01). *P<0.05 vs. non-sorted cells. p75NTR, p75 neurotrophin receptor; OD, optical density.

