Figure 1.
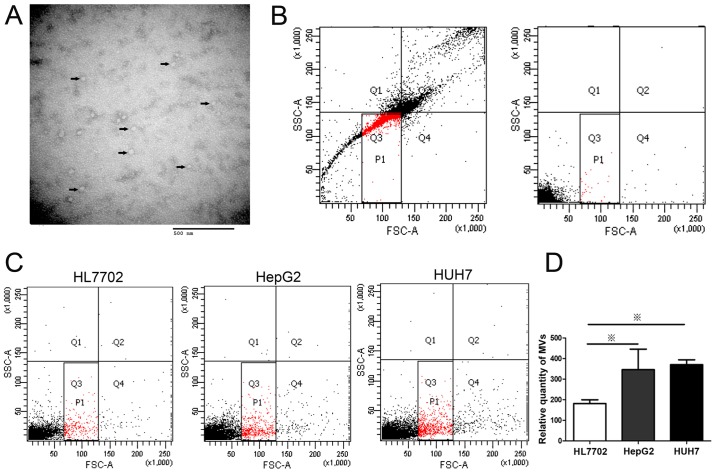
HepG2 and Huh7 cells release more MVs than HL7702 cells. MVs were isolated from the supernatant of cultured cells through ultracentrifugation. (A) Representative image of isolated MVs observed by transmission electron microscopy. Small 40- to 90-nm vesicles are indicated with arrows. (B) Construction of MV gates of flow cytometry using size-calibrated fluorescent beads (left) and medium (right). The solid square (P1) is the total MV gate. (C) MVs released from liver cell lines (HepG2, Huh7, and HL7702 cells) measured by flow cytometry. (D) Statistical analysis of MV release. HepG2 and Huh7 cells secreted more MVs than HL7702. ※P<0.05.

