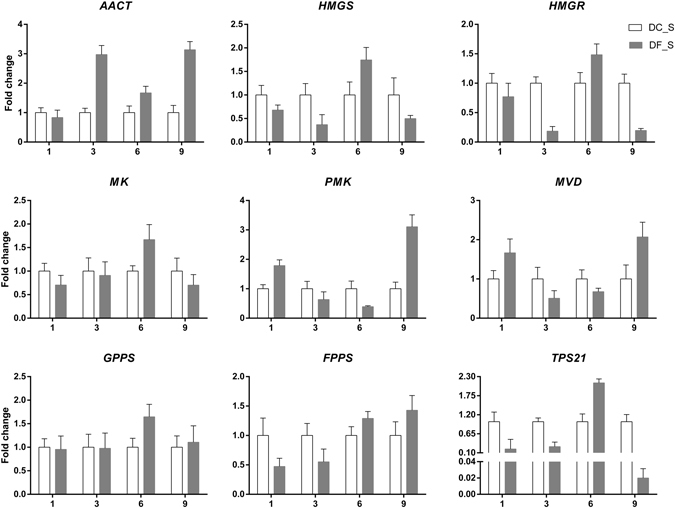
Figure 10.

qRT-PCR analysis of key enzyme-coding genes involved in the MVA pathway in D. nobile. The y-axes correspond to the mean fold changes in expression values, and the x-axes display the times of symbiotic culture (/weeks). White bars represent the control group (DC_S), and grey bars represent the model group (DF_S). For each qRT-PCR validation, three technical replicates were used, with a minimum of three biological replicates.
