Figure 5.

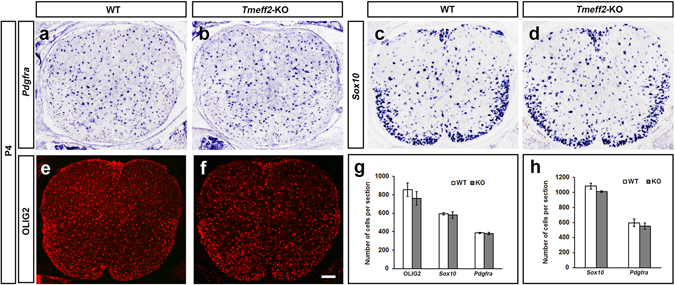
The number of OPCs is not affected in Tmeff2-KO mutants. (a–f) Expression of Pdgfra (a,b), Sox10 (c,d) and OLIG2 (e,f) as detected by ISH or immunofluorescence in wild type and mutant spinal cords at P4. Bar, 100 μm. (g,h) Statistical analysis of OLIG2+, Sox10+ and Pdgfra+ OPCs in P4 (g) and P8 (h) spinal cords. n = 3, p > 0.05.
