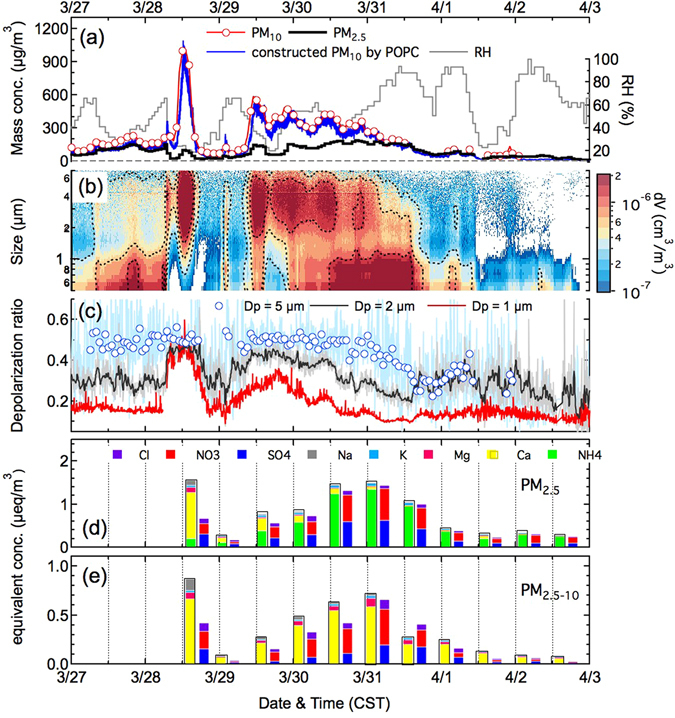
Figure 1.

Time series of the observed mass concentration of PM2.5, PM10 and constructed PM10 according to the POPC measurement, relative humidity (a), volume size distribution (b), hourly averaged depolarization ratio at Dp = 1 μm, 2 μm and 5 μm (c) and equivalent concentrations of identified water-soluble compounds in both the fine mode (PM2.5) (d) and coarse mode (PM2.5–10) (e) on the basis of filter-based chromatography analysis.
