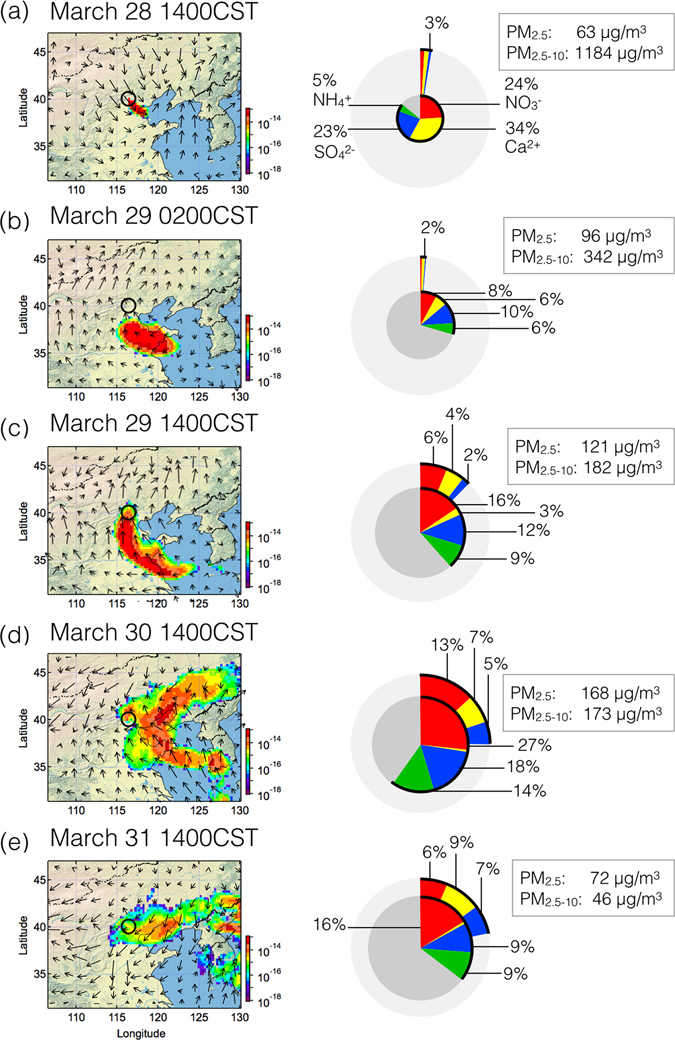
Figure 2.

Footprint of the dust plume simulated by the HYSPLIT dispersion model ((a) detailed description of the simulation is shown in Method) during the dust-influencing period (on the left). The tracer particles were released from 500–1000 m above ground level at the observation site and dispersed for 5 days. The mass concentration of the particle (in mass/m3) ranged from 0 to 1000 m every 3 hours. The figures on the right show corresponding mass concentrations of water-soluble inorganic matter (SO4 2−: blue; NO3 −: red; NH4 +: green; and Ca2+: yellow) in total PM2.5 (inner Pi-chart) and PM2.5–10 (outer gray ring). The maps were drawn by the software Igor Pro, http://www.wavemetrics.com/.
