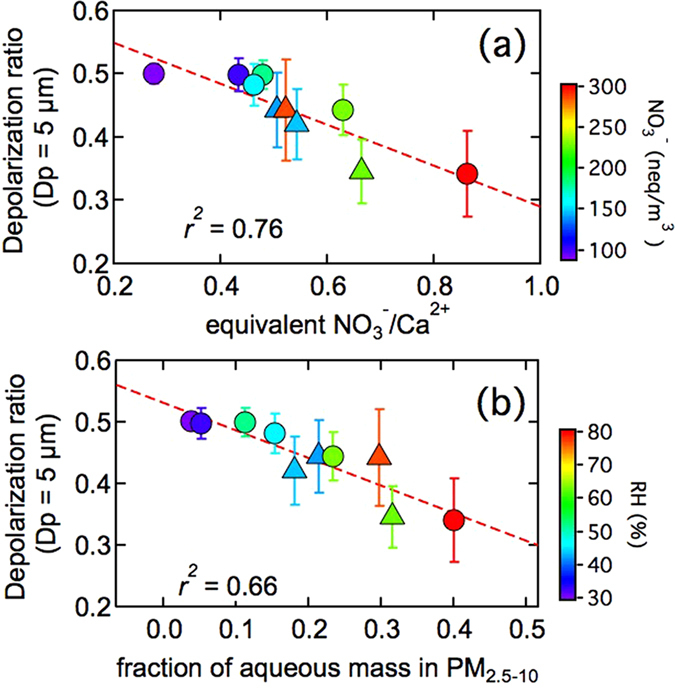
Figure 3.

Relationship between the depolarization ratio of dust particles (Dp = 5 μm) and equivalent ratio of NO3 −/Ca2+ (a) and the mass fraction of aqueous matter in the coarse mode (b). The colored circles in the plot represent the data during dust impact period from March 28 to April 1, 2015. The standard deviation (error bar) of depolarization ratio of dust particle was calculated for the dataset corresponding to filter sampling period. The color triangles indicate another weak floating dust case from April 9 to April 11, 2015. The backward trajectory analysis using HYSPLIT indicated that the air mass also came from northwest. Although none of the same dust plume was observed, the impact of anthropogenic pollutants on the depolarization ratio of the dust particle was similar.
