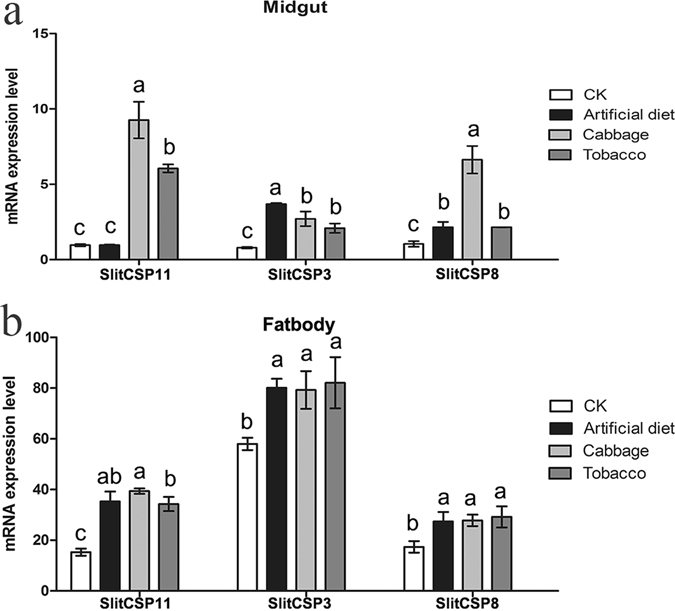
Figure 4.

Relative expression of SlitCSPs after different treatments in midgut and fatbody. (a) midgut; (b) fatbody. CK was negative control, which fed on nothing. 1, SlitCSP11; 2, SlitCSP3; 3, SlitCSP8. All the data represent the mean values ± S.E.M. of replicates. Different letters indicated significant differences of expression levels of candidate CSPs between the treated by treatments and CK, as determined using a t-test (p < 0.05).
