
Figure 2.
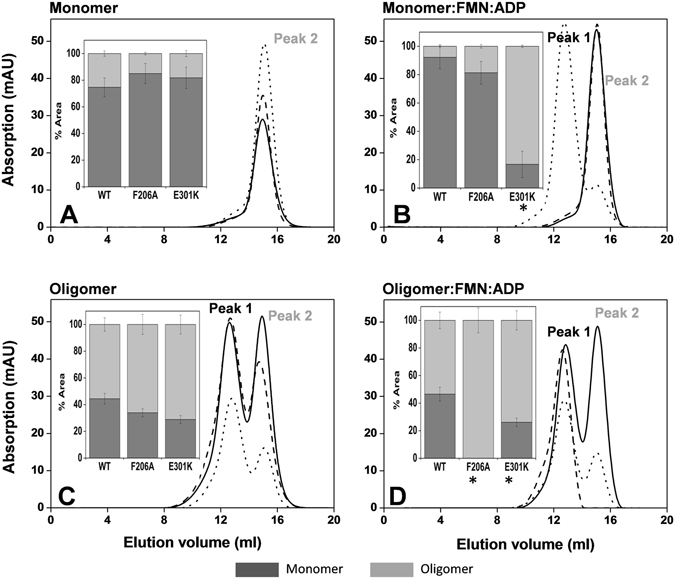
Gel filtration elution profiles of monomeric and oligomeric samples of WT (solid line), F206A (dashed line) and E301K (dotted line) CaFADSs after incubation under different conditions. (A) The peak corresponding to the monomeric form, which was used as a control. (B) The peak corresponding to the monomeric form, after incubation with 25 μM FMN and 200 μM ADP. (C) The band corresponding to the oligomeric forms, which was also used as a control. (D) The band corresponding to the oligomeric forms, after incubation with 25 μM FMN and 200 μM ADP. The insets show the percentage of monomer (represented by the peak labelled peak 2) and the bulk of oligomeric species (labelled as peak 1) obtained from the chromatograms, with *indicating values that show statistically significant differences from the WT, as determined by the one-way ANOVA test (P < 0.002; n = 3, confidence interval 95%). All samples contained 15–20 µM of protein, 20 mM PIPES, 0.8 mM MgCl2, pH 7.0, and were incubated 10 min at room temperature before passing through a Superdex™ 200 10/300 GL column in the same buffer.