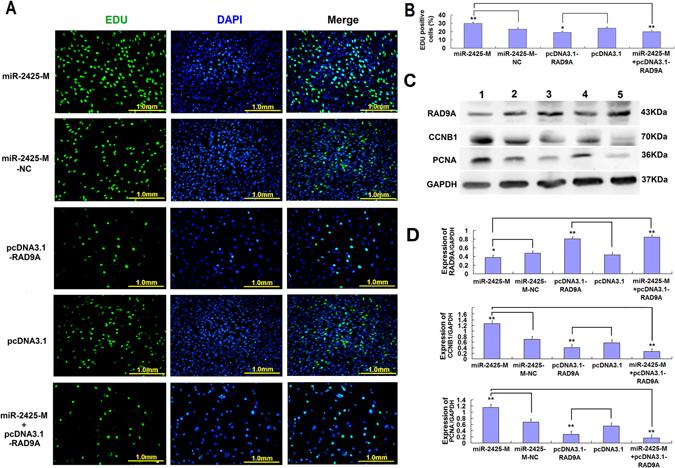
Figure 5.

Results of RAD9A rescue experiment. (A) MDSCs were labeled with EdU. EdU-positive cells, green; cell nuclei, blue; magnification, 200×. (B) Percentage of EdU-positive cells, n = 6. (C) RAD9A, CCNB1, and PCNA protein expression was examined 48 h after transfection with the following constructs: (1) miR-2425-M, (2) miR-2425-M-NC, (3) pcDNA3.1-RAD9A, (4) pcDNA3.1, (5) miR-2425-M + pcDNA3.1-RAD9A. (D) Quantified data shown in (C). *P < 0.05, **P < 0.01, NS: no significant difference.
