Figure 5.

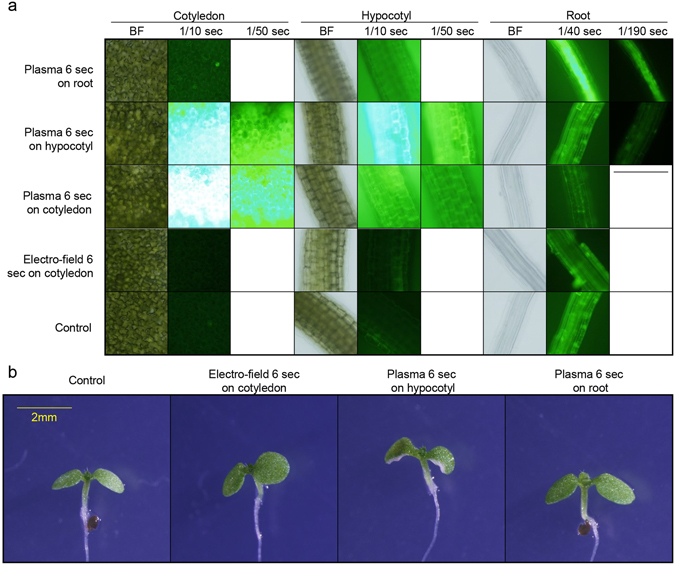
Photosynthetic organ treated plasma induces cell death. (a) Plasma treated in different organs for 6 seconds. BF indicates bright field. Time indication under indicated tissue is exposure time (seconds). Scale bar = 500 um. Representative image were determined from 5 experiments for each conditions. (b) Phenotype of seedlings treated with indicated conditions after 3 days of incubation in long day. Scale bar = 2 mm. Representative image were determined from 5 experiments for each conditions.
