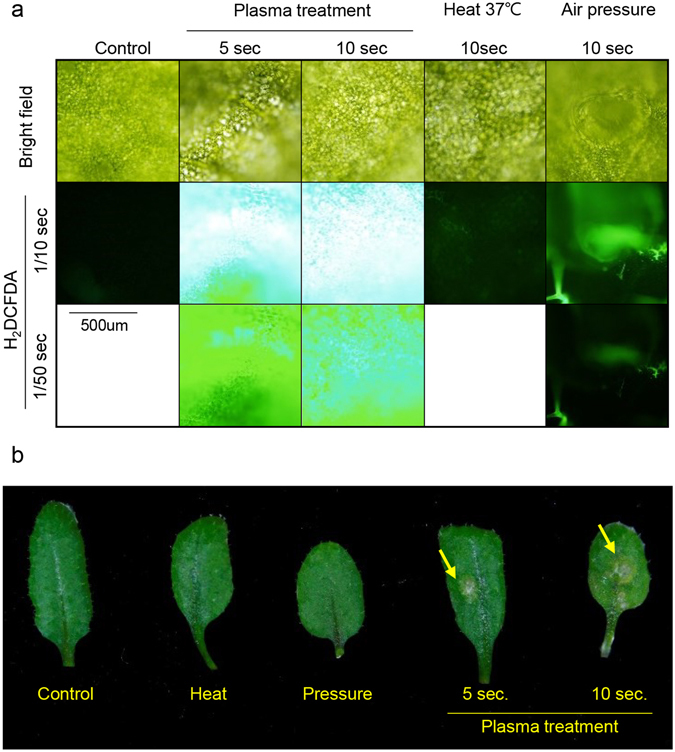
Figure 6.

Adult leaf treated with plasma. (a) DCFDA fluorescence image of adult leaf in treated area. Upper panel indicates treatments. Times indicated under H2DCFDA is exposure time (seconds). Scale bar = 500 um. Representative image were determined from 5 experiments for each conditions. (b) Phenotype of adult leaf after plasma treatment in long day condition for 3 days. Yellow arrow indicates plasma treated area. Heat and Pressure indicates 37 °C heat for 10 seconds and air pressure for 10 seconds, each.
