
Figure 7.
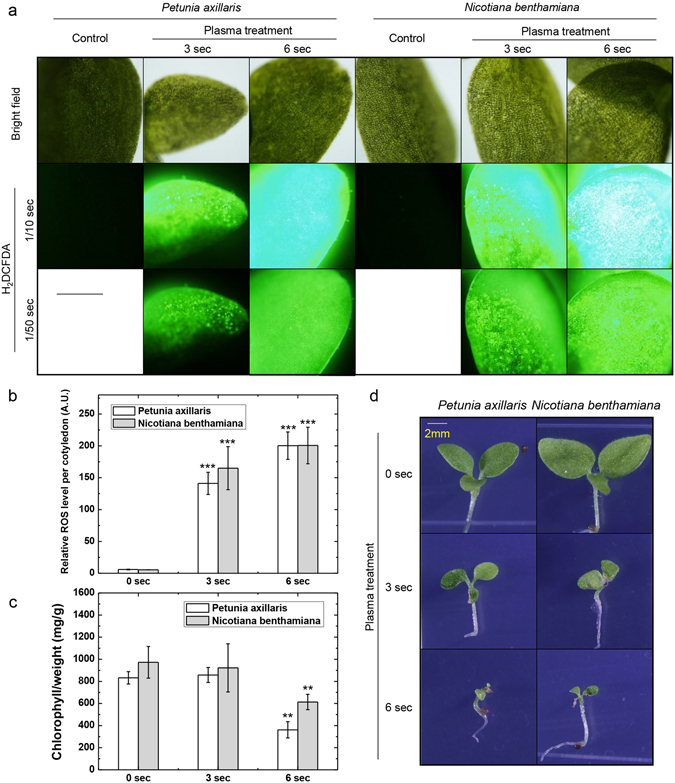
Petunia and tobacco seedlings treated with plasma accumulates ROS and induces cell death. (a) DCFDA image of plasma treated petunia and tobacco right after plasma treatment. Time indication under H2DCFDA indicates exposure time (sec.) Scale bar = 500 um. Representative image were determined from 5 experiments for each conditions. (b) Relative ROS level was measured in direct plasma treated seedlings and indirectly treated samples. To measure ROS level, we used 5 cotyledons treated with indicated conditions and DCFDA signal intensity were measured with same exposure time taken fluorescence image data. Signal was measured for whole cotyledon as mean grey value. Error bar = SD Student’s t-test were used to indicate significant difference from Mock treatment of each plant, * < 0.05, ** < 0.01, *** < 0.001. (c) Total chlorophyll level from samples after 5 days. 0 s, 3 s, and 6 s indicates plasma treatment time (seconds). Error bar = SD. Student’s t-test were used to indicate significant difference from Mock treatment of each plant, * < 0.05, ** < 0.01, *** < 0.001. (d) Phenotype of plasma treated seedlings after 5 days of plasma treatment in long-day incubation. Scale bar = 2 mm. Representative image were determined from 5 experiments for each conditions.