Figure 3.

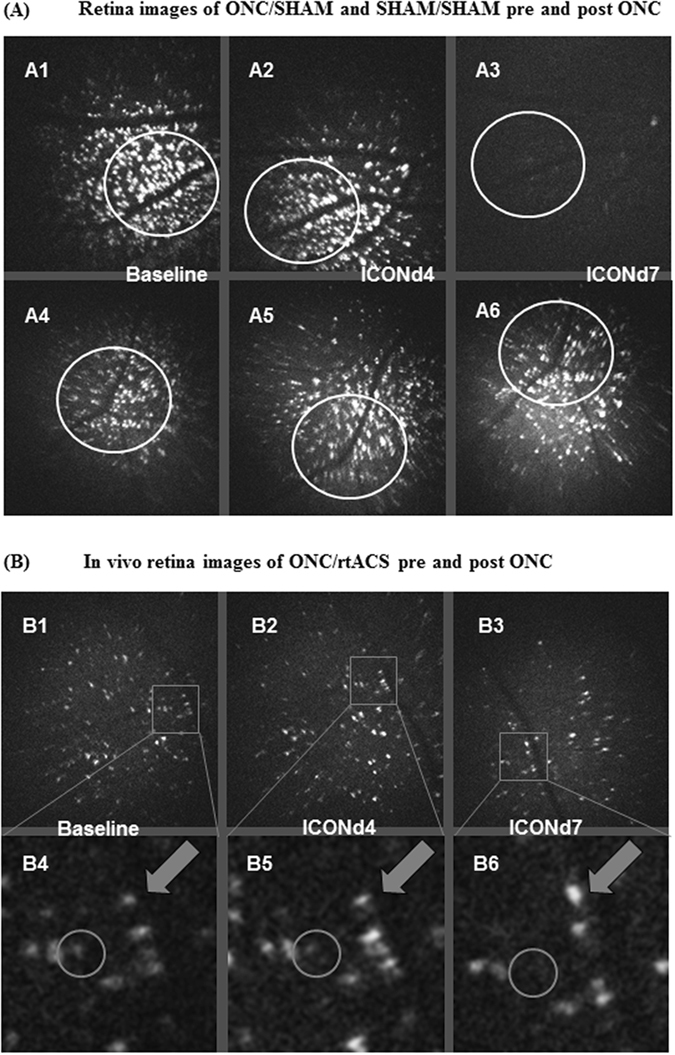
In vivo confocal neuroimaging (ICON) of the retina. These microphotographs demonstrate the in vivo morphological changes of retinal ganglion cells after ONC. In Fig. 3A1–A3 the preserved survival of RGCs on day 4 post ONC (A2) as compared to baseline (A1) is exemplified. The significant cell death in ONC/SHAM animals between day 4 and day 7 can be revealed when matching the images (A2) and (A3). The photomicrographs (A4), (A5) and (A6), showing the ICON results on baseline, day 4 post sham ONC, day 7 post sham ONC, indicate that in unlesioned rats no loss of RGCs developed within this period. The circles outline identical regions imaged at the different time points. Panel B displays the same region of the retina of an ONC/rtACS-treated animal, which was imaged repeatedly at several data acquisition points, i.e. before ONC (baseline; B1, B4), on day 4 (B2, B5) and day 7 post-ONC (B3, B6). The circles in the detailed images (B4), (B5), (B6) outline a single RGC with a rather weak fluorescence intensity which disappeared on day 7 after the crush. In contrast, the arrows in (B4), (B5), (B6) point to a cell which survived and which had an increased soma size at 7 days after ONC.
