
Figure 2.
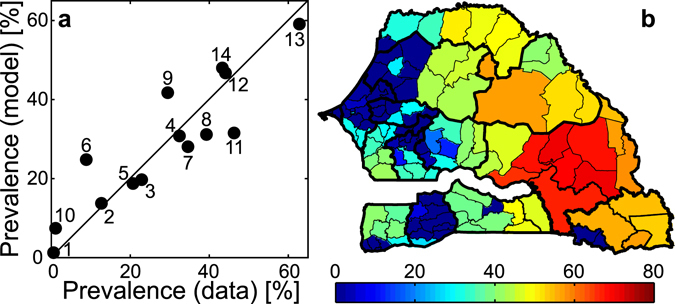
Reference model simulation and comparison with epidemiological evidence. (a) Quantitative agreement between simulated disease prevalence at the regional scale and the available data (labels as in Fig. 1b) for the best-fit model accounting for fine-grained spatial heterogeneity in transmission risk and human mobility estimated from CDRs (M4, reference model). (b) Projected schistosomiasis prevalence [% of people infected] at the scale of third-level administrative units as obtained from the reference model. Calibrated parameter values: β 0 = 5.5 · 10−3 [days−1], χ 0 = 2.2 · 10−6 [days−1 parasites−1], , . See Table 1 for parameter definitions and Methods for details on the model. The map in panel (b) has been created with QGIS 2.4 (QGIS Development Team, QGIS: A free and open source geographic information system, http://www.qgis.org/; last date of access: 03/02/2017) and MATLAB R2015b (MathWorks, MATLAB, http://www.mathworks.com/products/matlab/; last date of access: 03/02/2017).