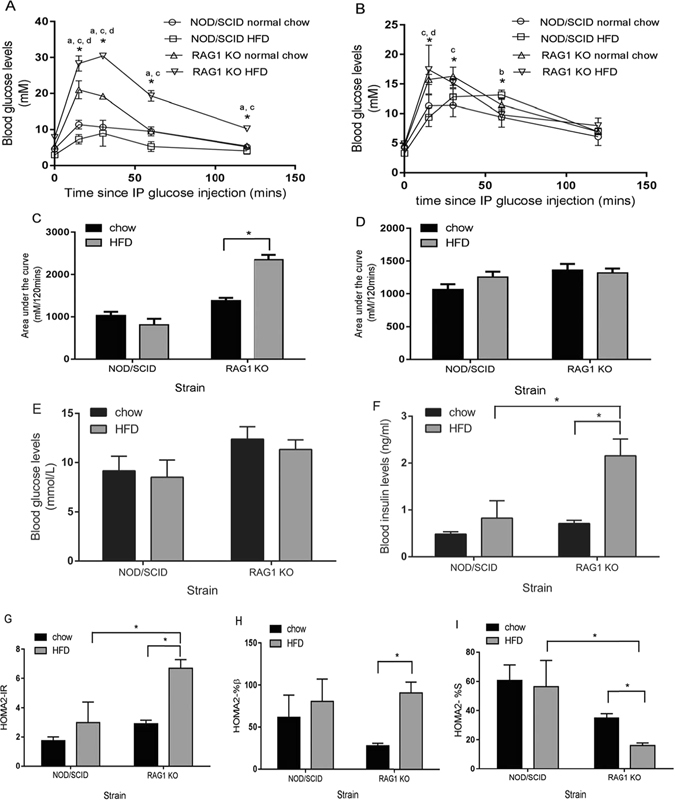
Figure 1.

The effects of high-fat diet (HFD) or low-fat chow on blood glucose and insulin levels, insulin resistance, and insulin sensitivity in Rag1 −/− and NOD/SCID mice. (A) Glucose tolerance (IPGTT) is impaired 16 weeks post-weaning in 23% high-fat diet (HFD) fed Rag1 −/− mice (n = 8) compared to Rag1 −/− mice fed low-fat chow (n = 4), and NOD/SCID mice fed HFD (n = 8), or low-fat chow (n = 4). (B) Glucose tolerance (IPGTT) is improved 23 weeks after diet initiation in Rag1 −/− HFD-fed mice, while glucose tolerance is impaired in NOD/SCID mice fed HFD. (C) Blood glucose levels (measured over 120 minutes of IPGTT and expressed as area under the curve) in Rag1 −/− and NOD/SCID mice fed low-fat chow or HFD at 16 weeks. (D) Blood glucose levels (measured over 120 minutes of IPGTT and expressed as area under the curve) at 23 weeks post diet initiation. (E) Fasting blood glucose levels measured at 28 weeks post-weaning. (F) Fasting insulin levels (ELISA) measured 28 weeks after diet initiation are significantly higher in Rag1 −/− HFD-fed mice compared to Rag1 −/− mice fed low-fat chow and NOD/SCID HFD-fed mice. (G) Insulin resistance, (Homeostatic model assessment for insulin resistance, HOMA-IR) is significantly higher in Rag1 −/− HFD-fed mice. (H) Steady-state β-cell function determined by Homeostatic model assessment for β-cell function (HOMA-β) is significantly higher in Rag1 −/− HFD-fed mice. (I) Insulin sensitivity, estimated using Homeostatic model assessment for (HOMA-S), is significantly lower in Rag1 −/− mice on a HFD. Mean + SEM. Two-way ANOVA and Tukey's multiple comparisons test *P ≤ 0.05. a = Rag1 −/− HFD vs. Rag1 −/− low-fat chow-fed mice, b = NOD/SCID HFD-fed vs. NOD/SCID low-fat chow-fed mice, c = Rag1 −/− HFD vs. NOD/SCID HFD-fed mice, d = Rag1 −/− low-fat chow vs. NOD/SCID low-fat chow-fed mice. All other data was tested for statistical significance using the Kruskal-Wallis and Mann-Whitney test. *P ≤ 0.05.
