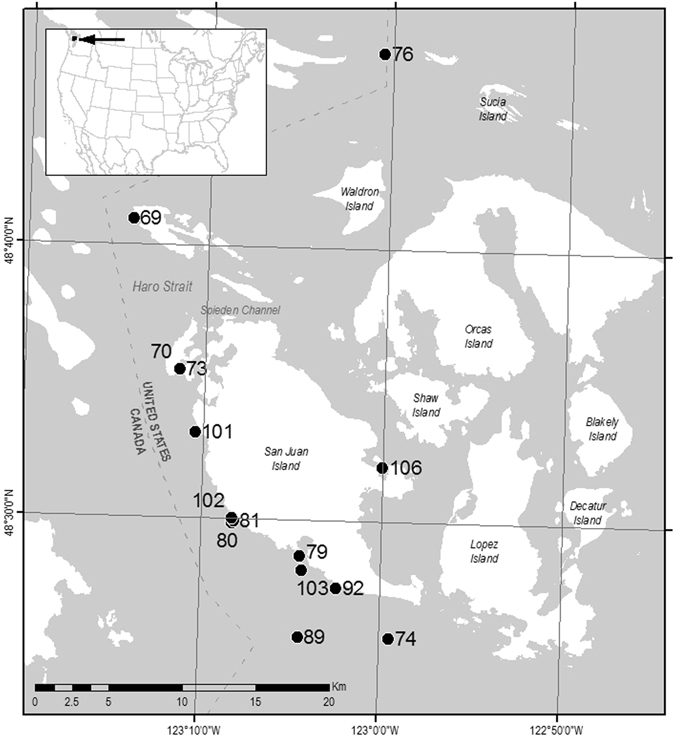
Figure 1.

Map of study area displaying locations of waypoints for SML sampling, and the relationship of the study area to the continental US (inset). Map with waypoints were generated by B. Sylvander (NOAA Fisheries) using ESRI ArcGIS Desktop 10.3.1 (http://desktop.arcgis.com/en/arcmap/10.3/main/get-started/whats-new-in-arcgis-1031.htm).
