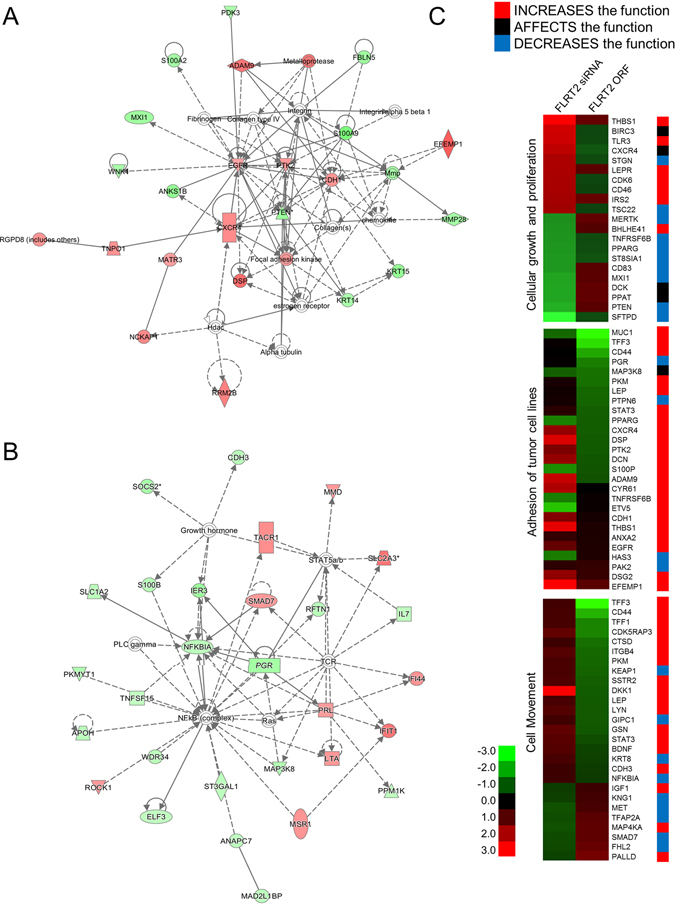
Figure 3.

FLRT2 regulates genes as a way of inhibiting cell proliferation. Highest confidence IPA networks of genes displaying altered expression as a consequence of downregulating (A) and overexpressing (B) FLRT2. The top networks were “Infectious Disease, Auditory Disease, and Cancer” for downregulation (A) and “Infectious Disease, Cell Signaling, Cell-To-Cell Signaling, and Interaction” for overexpression (B). Upregulated genes are shaded in red, while downregulated genes are shaded in green, with the color intensity indicating the magnitude of the expression change. Solid and dashed lines respectively represent direct and indirect interactions. (C) Of the genes affected by FLRT2, genes related to “cellular growth and proliferation”, “adhesion of tumor cell lines”, and “cell movement” were clustered in heatmaps. The colored bar to the right of the gene symbol signifies the activity of the cellular biofunctions based on information from Qiagen (http://www.sabiosciences.com/pathwaysonline/). Genes represented by red and blue bars exhibit expression changes in the direction of an increase and a decrease of the function, respectively. Genes in black bar are to affect the function, i.e., the genes are associated with biological function, but they have no direct effect on the activity.
