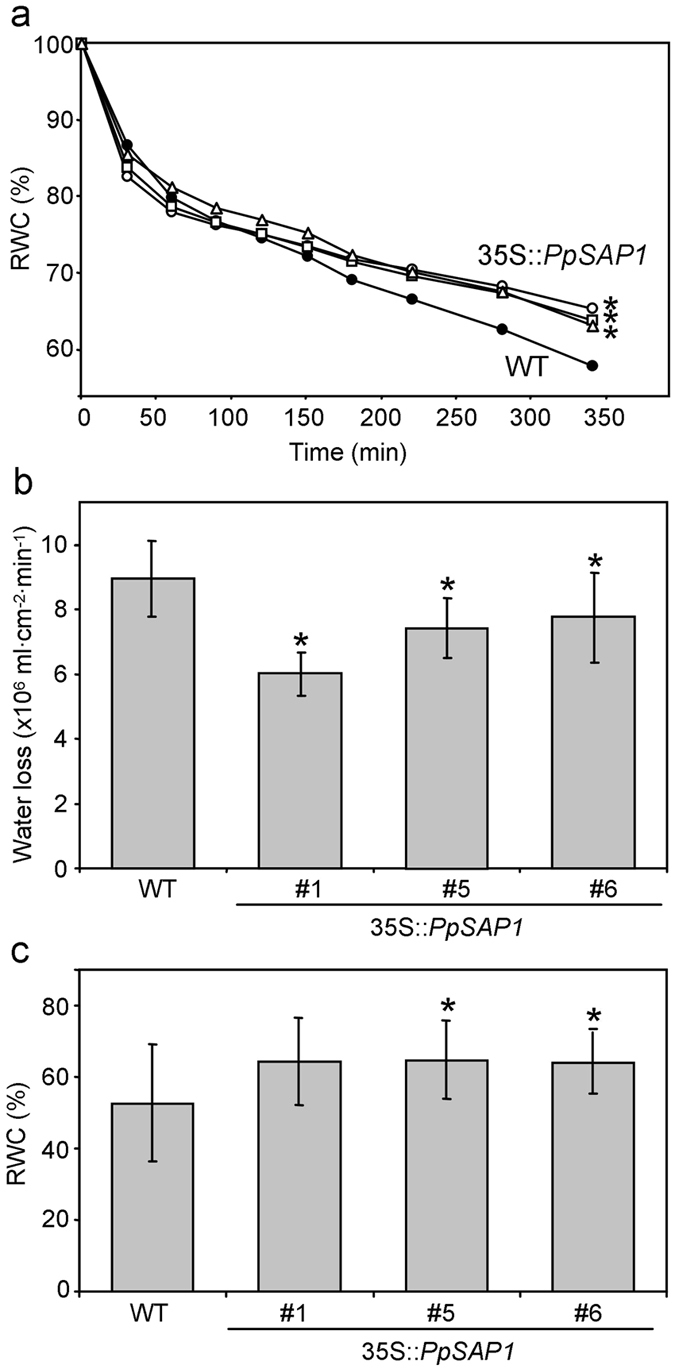
Figure 6.

Analysis of water retention in plum overexpressing PpSAP1 under drought stress. The relative water content (RWC) of leaves detached from wild type (WT, black circles), and 35S::PpSAP1 lines #1 (white circles), #5 (white squares) and #6 (white triangles) was calculated at different times along the desiccation process (a). Data are means from seven plants per genotype, and two leaves per plant. In (b), the specific water loss was calculated as the volume of water evaporated per cm2 of leaf area and minute, during the time in which evaporation was constant with time in the experiment shown in (a). In (c), the RWC of whole plants under drought stress for seven days is shown. Data are means from twelve different plants per genotype. Error bars represent standard deviation. An asterisk indicates significant difference with the control at a confidence level of 95%.
