Figure 4.

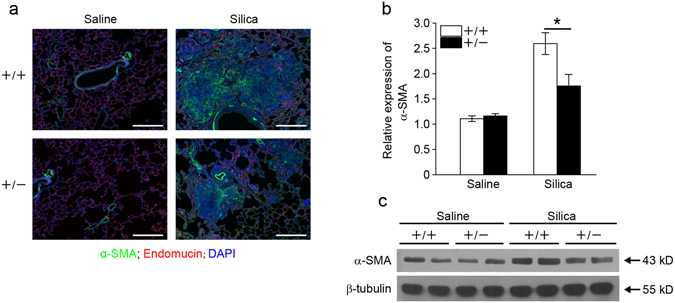
Fstl1 +/− mice have less myofibroblast accumulation after silica exposure. (a) Immunofluorescence analysis of α-SMA expression in lung sections of Fstl1 +/− and WT mice 21 days after saline or silica exposure. Representative images of the staining are shown. (α-SMA, green; Endomucin, red; nucleus, blue; scale bars, 200 μm). (b) qRT-PCR analysis of α-SMA mRNA expression in lung tissues from Fstl1 +/− and WT mice 21 days after saline or silica treatment (n = 3 per group; *P < 0.05 by one-way ANOVA followed by Student’s t test). (c) Western blot analysis of α-SMA expression in lung tissues from Fstl1 +/− and WT mice 21 days after saline or silica treatment. β-tubulin was used as a loading control.
