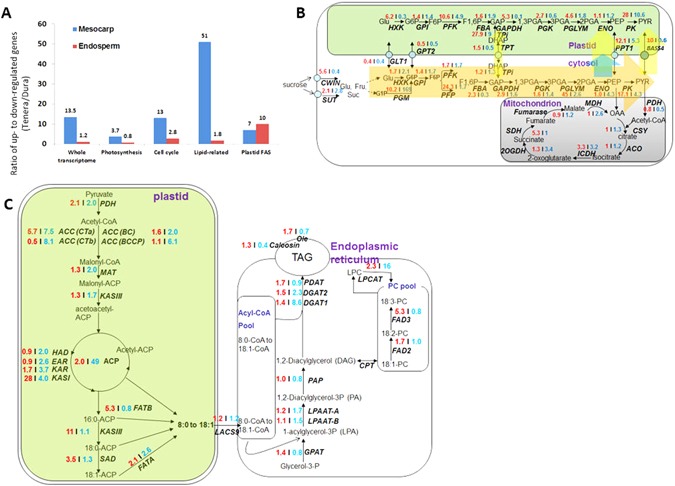
Figure 2.

Transcriptome pattern differs between two oil biosynthesis tissues in oil palm. (A) The ratio of up- to down-regulated genes when compared the transcription level of Tenera against Dura in mesocarp and endosperm. The gene expression level of their respective key stage (2.5 MAF for endosperm, 3.5 MAF for mesocarp) were used to compare. Assumed at least 2 folds change as up- or down-regulated genes. Whole transcriptome and some specific categorized pathways are listed out. Plastid FAS refers to the pathway of fatty acid synthesis in plastid. Noticed that genes of lipid related or plastid FAS are highly upregulated in mesocarp and endosperm of Tenera respectively. (B) Transcripts patterns for enzymes involved in glysolysis reactions for Dura and Tenera. Values in red indicate the fold increase in reads of mesocarp of Tenera to that of Dura at 3.5 MAF. Values in blue indicate the fold increase in reads of endosperm of Tenera to that of Dura at 2.5 MAF. Samples collected from different tissues for Dura, Pisifera and Tenera (#53) were used for transcriptome analysis. Orange arrow indicates the cytosolic glycolytic process is the major carbon flow increased in Tenera compared with Dura both in mesocarp and endosperm, as deduced by the fold increase in reads. Light yellow arrows indicate the major increased cytosol-to-plastid carbon flow for mesocarp. Light blue arrow indicates the major increased cytosol-to-plastid carbon flow for endosperm. (C) Transcripts patterns for enzymes involved in plastidial and extraplasidial reactions for Dura and Tenera. Values in red indicate the fold increase in reads of mesocarp of Tenera to that of Dura at 3.5 MAF. Values in blue indicate the fold increase in reads of endosperm of Tenera to that of Dura at 2.5 MAF. Samples collected from different tissues for Dura, Pisifera and Tenera (#53) were used for transcriptome analysis. Reads for enzymes with multiple isoforms were summed. For details on abbreviations, annotations, and transcriptome levels at each samples, see Dataset S1. 16:0, palmitic acid; 18:0, stearic acid; 18:1, oleic acid, 18:2, Linoleic acid; 18:3, linolenic acid. For details on abbreviations, annotations, and transcription levels at each stage, see Supplemental Dataset S1.
