
Figure 4.
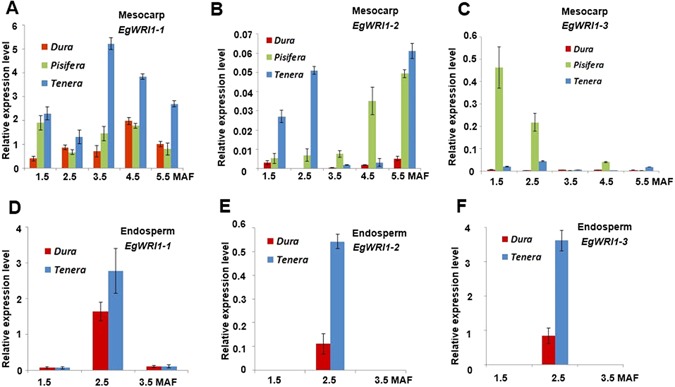
Relative expression of three WRI1 genes (EgWRI1-1, -2, -3) in mesocarp (A–C) and endosperm (D–F). The data was presented as means ± standard deviations (n = 3).
Official websites use .gov
A
.gov website belongs to an official
government organization in the United States.
Secure .gov websites use HTTPS
A lock (
) or https:// means you've safely
connected to the .gov website. Share sensitive
information only on official, secure websites.
Relative expression of three WRI1 genes (EgWRI1-1, -2, -3) in mesocarp (A–C) and endosperm (D–F). The data was presented as means ± standard deviations (n = 3).