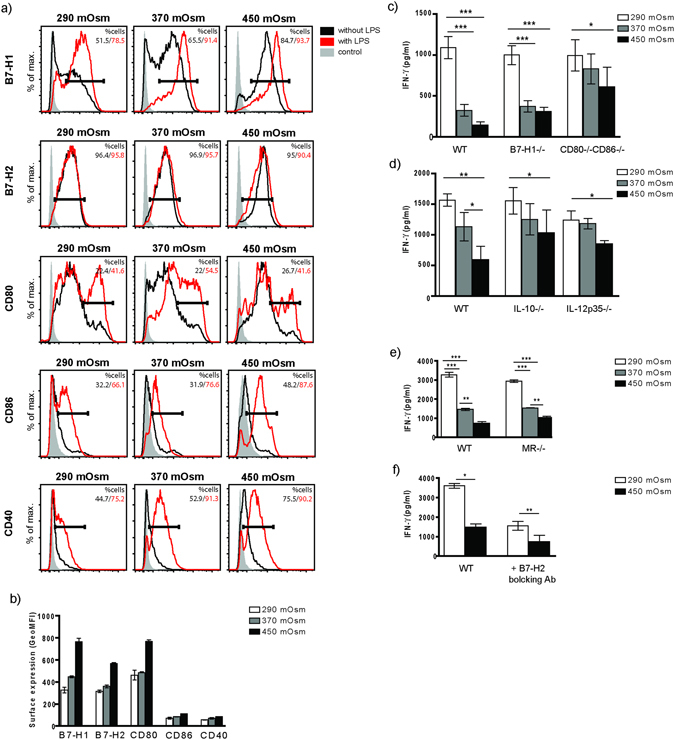
Figure 3.

High salt micromilieu modifies surface expression of co-stimulatory and co-inhibitory molecules on BMDCs. (a) Representative histogram plots displaying relative surface expression intensity for B7-H1, B7-H2, CD80, CD86 and CD40 (black contour represents BMDCs raised in endotoxin-free conditions; red contour shows receptor expression by BMDCs stimulated by LPS) with (b) corresponding statistical graph showing geometric mean fluorescent intensity (GeoMFI) of surface receptor expression without LPS stimulation. Histogram depicts all events after gating on living cells. (c–e) BMDCs of B7-H1−/−, CD80-CD86−/−, IL-10−/−, IL-12p35−/− and MR−/− origin were raised in indicated NaCl-hypertonic conditions and prepared as described in Fig. 2 for the T cell activation assay. B7-H2 on WT BMDCs was blocked as described earlier (f). IFN-γ was measured from cell culture supernatants. Statistical data are expressed as mean ± SEM and are representative of two independent experiments (*p ≤ 0.05, **p ≤ 0.01, ***p ≤ 0.001; n = 6 for B7-H1−/−, CD80-CD86−/− and IL-12p35−/−; n = 4 for IL-10−/−, MR−/− and B7-H2 experiments).
