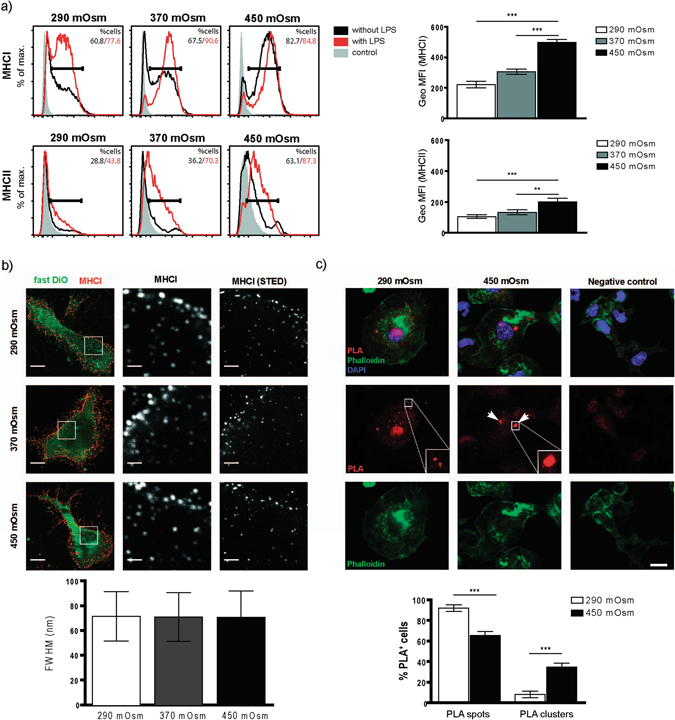
Figure 4.

BMDCs matured in NaCl-rich microenvironment have higher surface expression of MHCI and show surface clustering of MHCI-SIINFEKL complex upon OVA uptake. (a) Representative histogram plots displaying relative surface expression intensity of MHCI (upper graph) and MHCII (lower graph) by BMDCs from indicated media osmolarities (black contour represents BMDCs raised in LPS-free conditions; red contour shows receptor expression by BMDCs stimulated by LPS) with corresponding statistical graphs showing GeoMFI data for LPS-free samples (right). (b) MHCI was immunostained for stimulated emission depletion (STED) imaging in BMDCs cultured in medium with an osmolarity of 290 mOsm, 370 mOsm or 450 mOsm, without addition of OVA. Column 1 shows standard confocal micrographs of MHCI clusters (red) in cells with Fast DiO membrane counterstaining (green) with scale bars indicating 5 μm. In the areas marked with a white box, MHCI was imaged using STED superresolution microscopy (column 3) and for comparision with the same settings without STED (column 2). Scale bars indicate 1 μm (101–171 clusters from 13–15 cells per condition, one experiment). Analysis of the MHCI cluster size revealed a similar full width at half maximum (FWHM) of around 71 nm for all three culturing conditions. (c) BMDCs cultured in 290 mOsm (left column) and 450 mOsm (middle column) plated on cover slips were incubated with 0.5 mg/mL OVA for 4 hours, fixed and stained in a proximity ligation assay (PLA) with anti-MHCI antibody and 25D1.16.APC antibody. PLA-spots (visible only in the case of specific binding of both antibodies in each other’s proximity) and –clusters (defined as a convincing grouping of multiple spots) were detected using Keyence BZ-9000 microscope (enlarged in the areas marked with a white box). A weak red fluorescence background in the nuclear area is occasionally observed. Scale bar indicates 10 µm. The right column shows negative control, omitting the anti-MHCI antibody. Statistical analysis (lower graph) demonstrates distribution of spots and clusters in 290 mOsm and 450 mOsm groups, displayed as % of PLA-positive cells having either spots or clusters. The data are displayed as mean ± SEM from two pooled experiments (***p ≤ 0.001, n = 19–30 high power fields).
