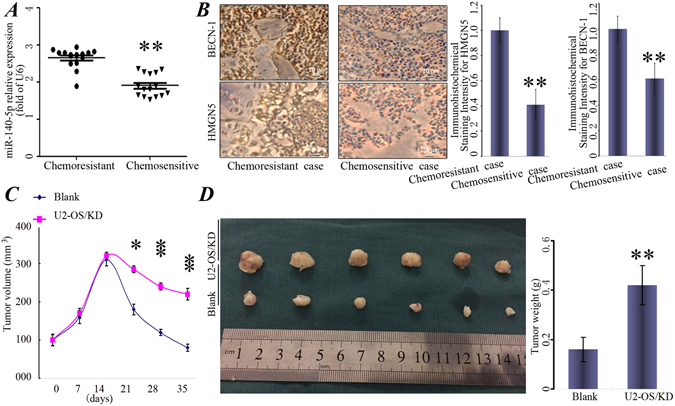
Figure 6.

miR-140-5p is associated with chemoresistance and increased the chemoresistance. (A) miR-140-5p expression was assessed in chemosensitive patients (n = 15) and chemoresistant patients (n = 15). (B) Representative photographs of IHC stained human osteosarcoma tissue specimens at a magnifcation of 200x. HMGN5 and BECN-1 were markedly up-regulated in chemoresistant patients. Columns, mean of intensity of the staining (n = 15). (C) The tumor volumes were calculated as V = length × width2/2 and measured at 1, 2, 3, 4, 5 weeks time points. (D) Representative photos for tumor isolated from the nude mice (n = 6). U2-OS/KD cells or control cells (Blank) were transplanted in the left and right side of the mice, respectively. P < 0.05, **P < 0.01 vs Blank.
