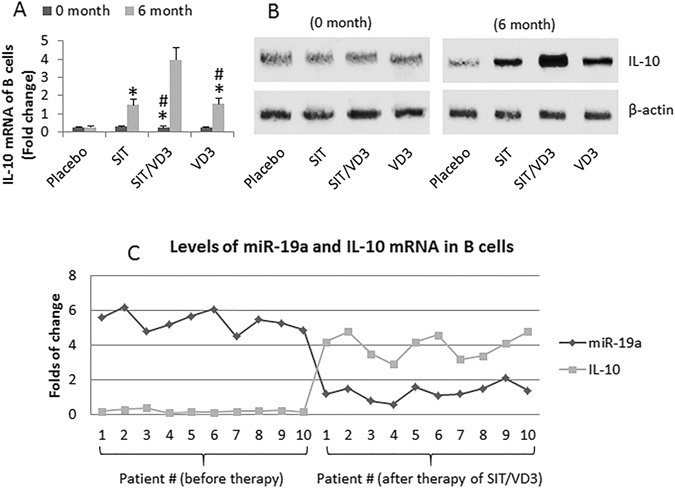
Figure 5.

IL-10 expression in B cells and its correlation with miR-19a. (A,B) (20 patients/group), peripheral B cells of AR patients were prepared before the therapy (0 month) and 6 month after the start of the therapy (as denoted on the X axis); the B cells were analyzed by RT-qPCR and Western blotting. (A) The bars indicate the IL-10 mRNA in B cells (mean ± SD). (B) The immune blots indicate the protein levels of IL-10. (C) The curves indicate the individual data of miR-19a levels and IL-10 mRNA levels in the B cells of 10 randomly selected AR patients. *p < 0.01, compared to the placebo group. #p < 0.01, compared with the SIT/VD3 group. The full-length gels and blots are included in the supplementary information.
