
Figure 6.
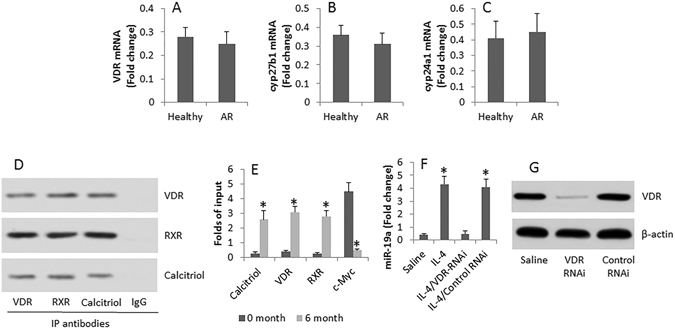
VD3 modulates miR-19a transcription in B cells. (A–C) The bars indicate the expression of VDR (A), cyp27b1 (B) and cyp24a1 (C) in peripheral B cells of healthy persons and AR patients. (D) The immune blots indicate a complex of VDR, RXR and calcitriol in peripheral B cells of AR patients at month 6 after the commerce of the therapy of SIT/VD3. (E) The bars indicate the levels of calcitriol, VDR, RXR and c-Myc at the miR-19a promoter locus. (F) The bars indicate the miR-19a levels in B cells after the treatment denoted on the X axis. (G) The immune blots show the VDR RNAi results in B cells. The data are representative of 3 independent experiments. Data of bars are presented as mean ± SD. *p < 0.01, compared with “0” month (E) or saline group (F). The full-length gels and blots are included in the supplementary information.