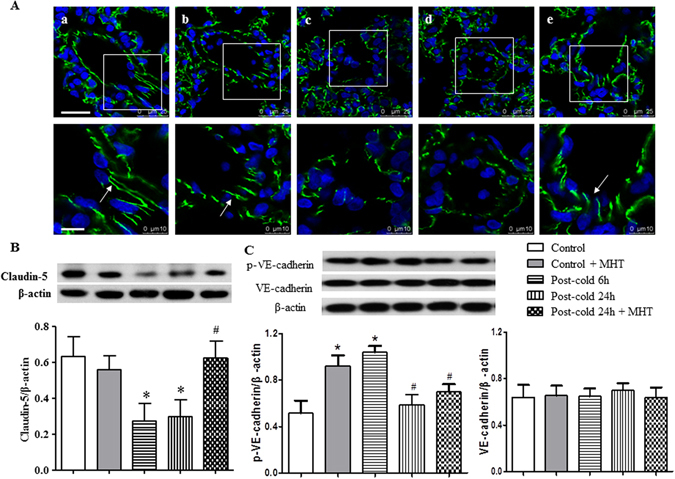
Figure 4.

Effect of MHT post-treatment on the expression of Claudin-5 and activation of VE-cadherin in the rat lung tissues. (A) Representative immunofluorescence confocal images of rat lung tissue in Control (a), Control + MHT (b), Post-cold 6 h (c), Post-cold 24 h (d), and Post-cold 24 h + MHT (e) group, respectively. Bar = 25 μm. The area within the rectangle in each image in upper panel is enlarged and presented below. Bar = 10 μm. The sections were immunochemically stained for Claudin-5 (green). (B) Western blot for the expression of Claudin-5 in different groups with the quantification of Claudin-5 showing below. (C) Western blot for the VE-cadherin in different groups with the quantification of Claudin-5 showing below. N = 4. Results are presented as mean ± SE. *P < 0.05 vs. Control group; #P < 0.05 vs. Post-cold 24 h group.
