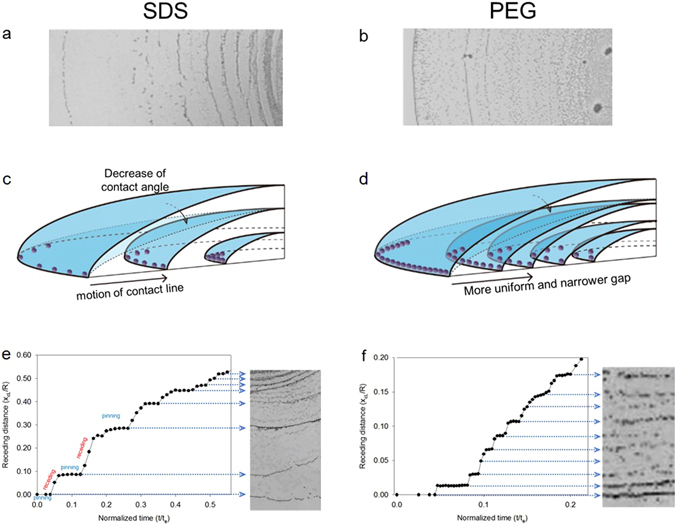
Figure 3.

Analyses of the contact line motion: pinning and receding. Photographic images depicting the multiple rings observed in the (a) SDS and (b) PEG droplet. Schematic images of the (c) SDS and (d) PEG droplet during evaporation. Profiles of the contact line migration distance (x c) of the (e) SDS and (f) PEG droplets from the initial contact line by time. The distance and length were measured five times.
