Figure 1.

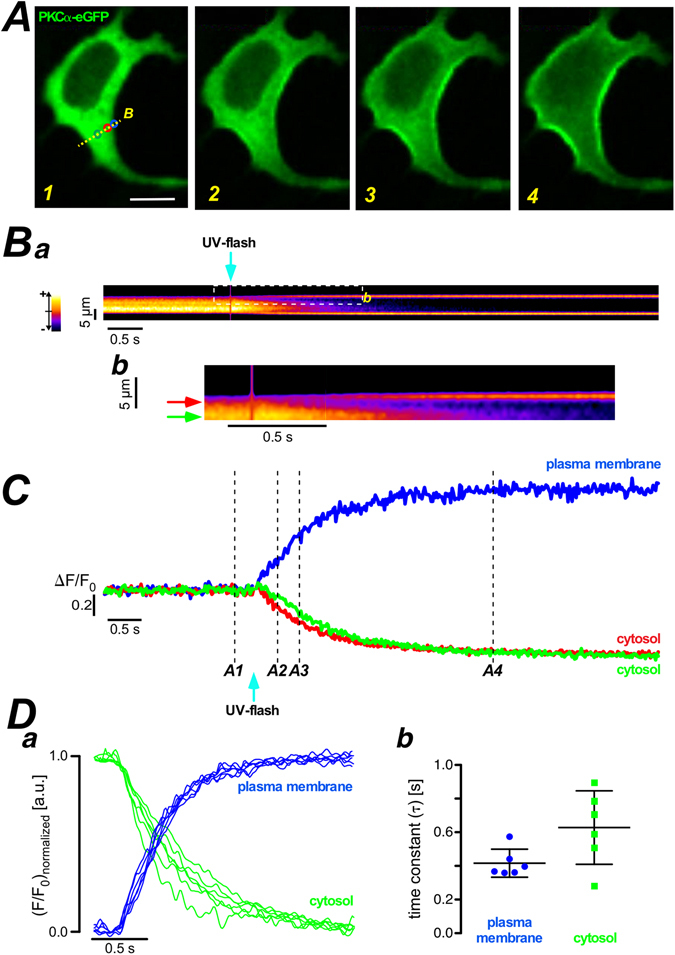
Quantitative analysis of PKCα-eGFP translocation from cytosol to plasma membrane. (A) PKCα-eGFP distribution in HEK293 cells at the resting state – left panel. Fluorescent images of PKCα-eGFP distribution upon UV-flash in NP-EGTA loaded HEK293 cells at the time points indicated in (C). Scale bar is 10 μm. (Ba) The pseudo line scan at the labeled position (yellow dash line in the panel A1). Part of the pseudo line scan image (dashed box) was redrawn at a higher magnification in (Bb). The color wedge in (Ba) shows the color-coding of the relative fluorescence changes as indicated. (C) Plots of fluorescence over time at the plasma membrane (blue) and the cytosol (green and red) from the regions of interest, marked in panel A1. The numbers at the traces correspond to the numbered images in (A). (Da) Fluorescence over time plots of 6 regions of interest randomly chosen in the cytosolic (green) and at the plasma membrane (blue). (Db) Statistical summary of the analysis of the time constant for the traces depicted in the left panel. The scatter plot depicts individual values (symbols), the mean and the standard deviation. Similar results were found in all 7 cells analyzed in a similar way.
