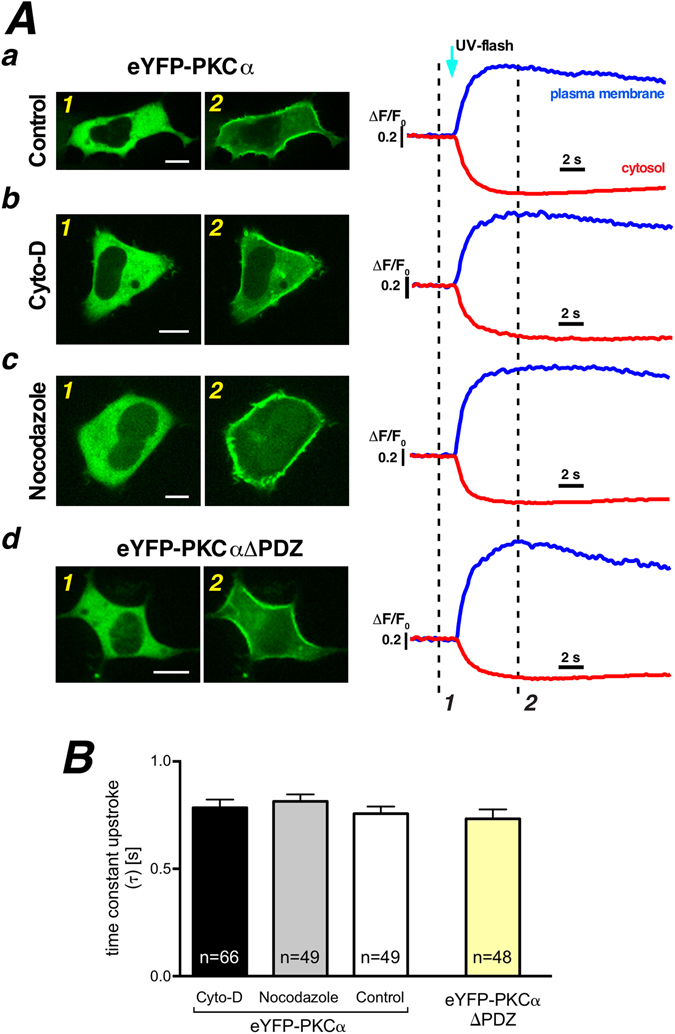
Figure 4.

PDZ ligand motif of PKCα does not contribute to Ca2+ induced PKCα translocation. (A) Exemplified single images of eYFP-PKCα distribution before (Aa1, Ab1, Ac1) and following photolytic Ca2+ increase (Aa2, Ab2, Ac2) at the time points marked in the traces to the right. Three different experimental treatments are depicted (Aa-control, Ab-Cyto-D treatment, Ac-nocodazole treatment). Distribution of eYFP-PKCαΔPDZ in HEK293 cell before (Ad1) and after photolytic Ca2+ increase (Ad2). Traces were generated from regions of interest in the cytosol (red traces) and on the plasma membrane (blue traces). (B) The statistical summary of plasma membrane accumulation time by fitting an exponential to the upstroke following the flash photolytic Ca2+ increase. Numbers given on the bars indicate number of cells in at least 5 independent experiments.
