Figure 3.

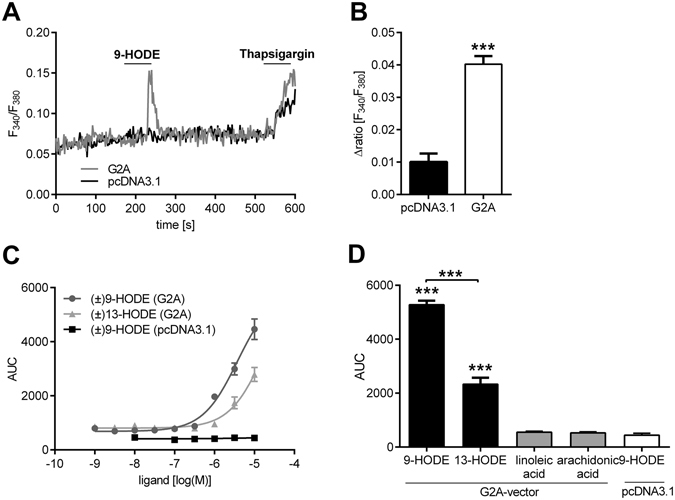
9-HODE activates the G2A-receptor (GRP132). (A,B) Shown are calcium concentrations of HEK-293 cells transfected with G2A-vector or pcDNA3.1 (empty vector) stimulated with 9-HODE (1 µM). Thapsigargin (1 µM) was used as positive control. (A) Shows a representative trace and (B) the quantitative analysis presented as mean ± SEM with n = 32–46 cells per condition. ***p < 0.001 unpaired student’s t-test. (C) Dose-response analysis of COS-1 cells co-transfected with aequorin- and G2A-expressing vector or pcDNA3.1 (empty vector). Seen is the calcium flux as area under curve (AUC) at different 9-HODE and 13-HODE concentrations [10−9–10−5 M]. Data are presented as mean ± SEM from n = 3 measurements. (D) COS-1 cells cotransfected with aequorin- and G2A-expressing vector stimulated with 9-HODE (10 µM), 13-HODE (10 µM), linoleic acid (30 µM) and arachidonic acid (30 µM). Shown is the calcium flux as mean of area under curve (AUC) ± SEM with n = 3 measurements; ***p < 0.001 one-way ANOVA with Bonferroni post-hoc test.
