Figure 1.

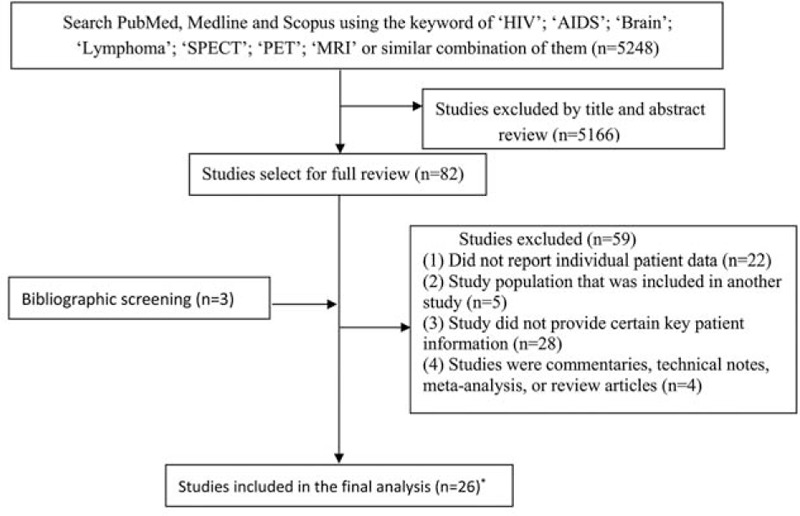
Flow chart for the identification of eligible studies. ∗Westwood et al studied both PET and MRS. MRS = magnetic resonance spectroscopy, PET = positron emission tomography.

Flow chart for the identification of eligible studies. ∗Westwood et al studied both PET and MRS. MRS = magnetic resonance spectroscopy, PET = positron emission tomography.