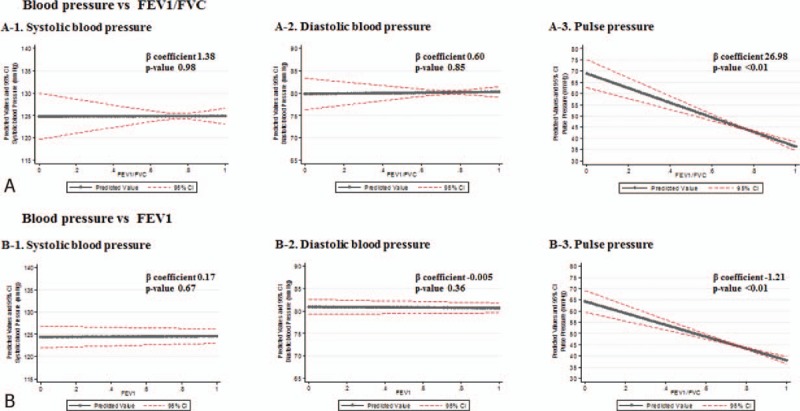
Figure 2.

Correlation between lung function and blood pressure determined by linear regression analysis after adjusting covariates. Solid line denotes regression line between lung function and blood pressure and broken red line denotes 95% confidence interval. FEV1 = forced expiratory volume in 1 s, FEV1/FVC = the ratio of forced expiratory volume in 1 s to forced vital capacity, FVC = forced vital capacity.
