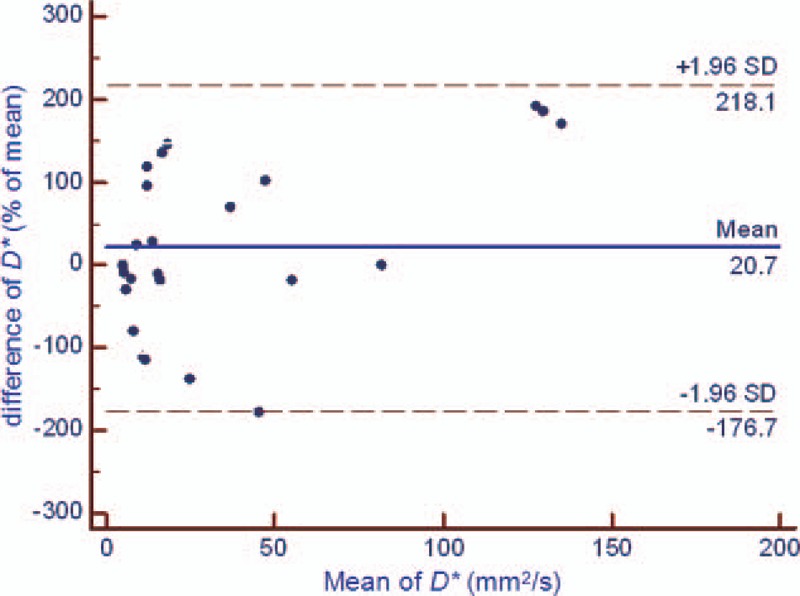
Figure 5.

Bland-Altman plot of repeatability of the DWI-derived parameters (D∗) for test and retest DWI imaging of rectal cancer. The horizontal full line represents the bias, and the dotted lines represent the 95% confidence interval. ADC = apparent diffusion coefficient, DWI = diffusion-weighted imaging, SD = standard deviation.
