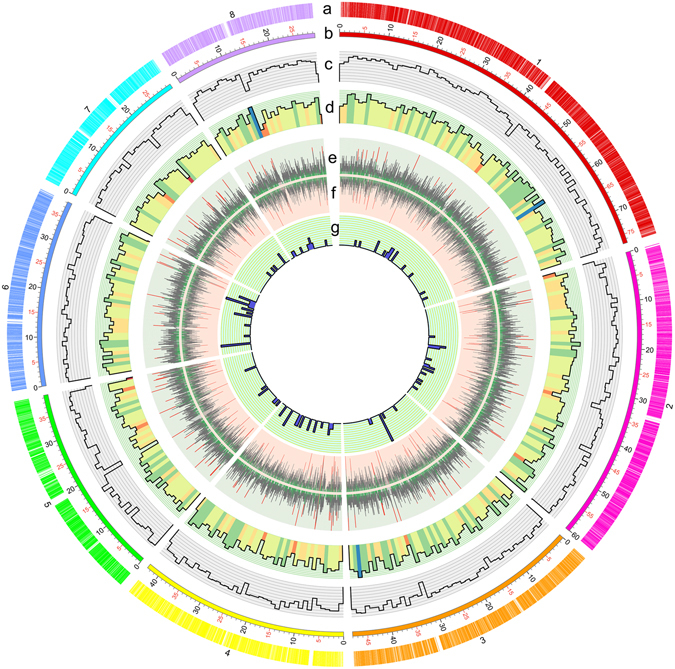
Figure 1.

Circular map of genomic features of the T. pinophilus 1–95 genome. (a) Location of predicted genes. Numbers represent predicted chromosomes. (b) Schematic representation of genomic characteristics of T. pinophilus pseudogenome (Mb scale). (c) Gene density represented by number of genes in 100-kb nonoverlapping windows. (d) Gene density of genes annotated by the GO database in each 100-kb window. (e) Exon positions of protein-coding genes (circle). Red, exon number (>10) in a gene; green, one exon included. (f) Intron positions of protein-coding genes (circle). Red, exon number (>10) in a gene; green, no intron included. (g) The tRNA density represented by number of tRNAs in 100-kb nonoverlapping windows.
