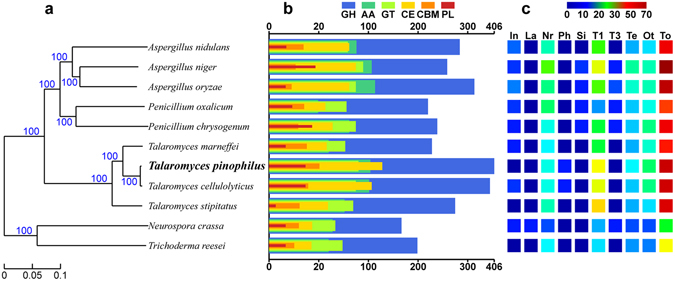
Figure 2.

Comparative genomic analysis of T. pinophilus and other fungal species. (a) Maximum-likelihood phylogenetic tree of T. pinophilus and 10 fungal species. (b) Comparative analysis of carbohydrate-active enzyme (CAZyme) numbers. GH, glycoside hydrolase; AA, auxiliary activity; GT, glycosyl transferase; CE, carbohydrate esterase; CBM, carbohydrate-binding module; PL, polysaccharide lyase. (c) Comparative analysis of secondary metabolite gene cluster numbers. In, Indole and Indole-Nrps; La, Lantipeptide; Nr, Nrps, Nrps-Indole, Nrps-T1pks and Nrps-Terpene; Ph, Phosphonate; Si, Siderophore; T1, T1pks, T1pks-Indole and T1pks-Nrps; T3, T3pks; Te, Terpene-Nrps, Terpene-Nrps-Indole and Terpene-T1pks; Ot, Others; To, total number of secondary metabolite gene clusters. Vertical axes in (b) and (c) correspond to fungal species in (a).
