
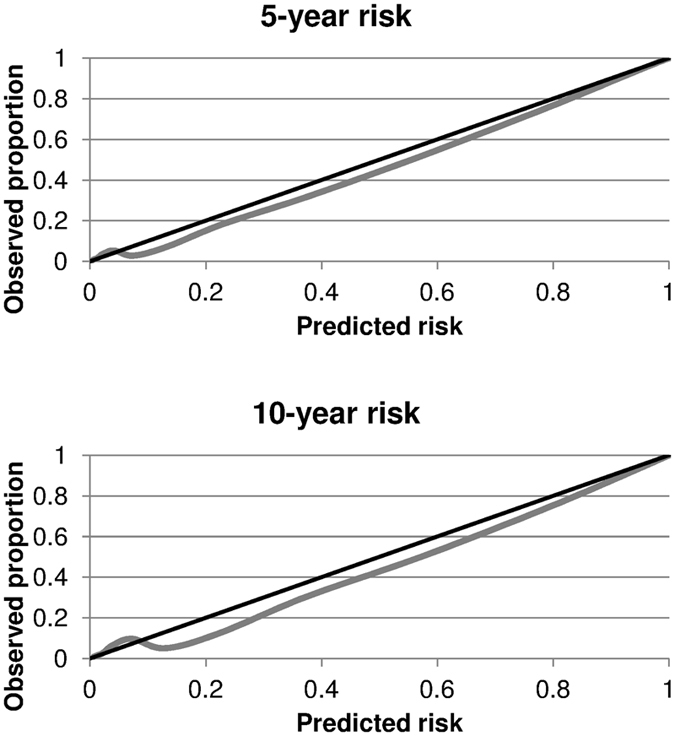
Figure 4.
Smooth calibration plots for the validation of our scoring system using the bootstrap method. The black line represents perfect calibration and the grey line indicates the results of our calibration.
Official websites use .gov
A
.gov website belongs to an official
government organization in the United States.
Secure .gov websites use HTTPS
A lock (
) or https:// means you've safely
connected to the .gov website. Share sensitive
information only on official, secure websites.
Smooth calibration plots for the validation of our scoring system using the bootstrap method. The black line represents perfect calibration and the grey line indicates the results of our calibration.