
Figure 2.
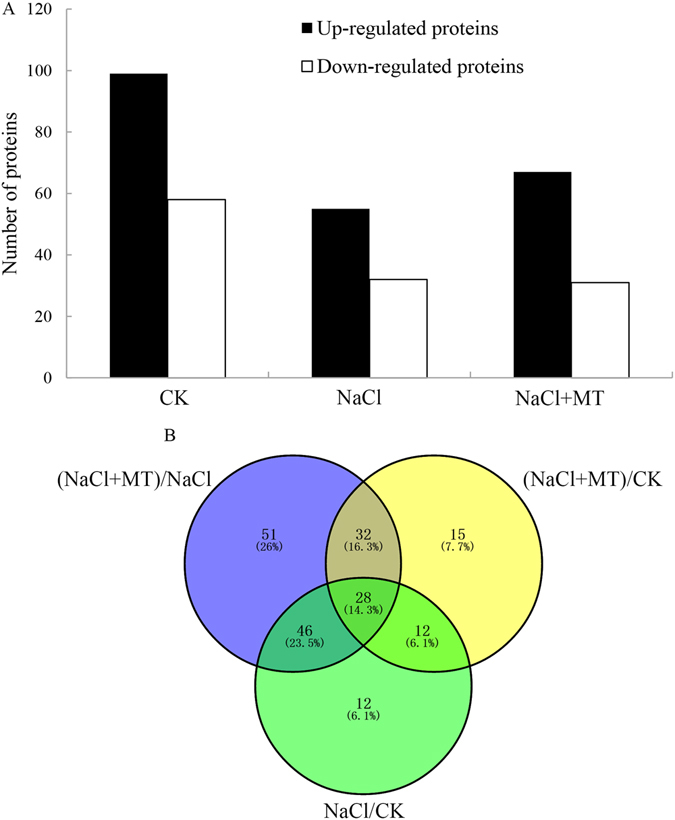
Distribution of differentially expressed proteins by melatonin and NaCl stress grass. (A) The number of differentially expressed proteins (fold change ≥ ± 2.0 and P value < 0.05). (B) Venn diagram showing the number of overlapping proteins that were differentially expressed between melatonin-treated seeds and NaCl stress conditions.