
Figure 3.
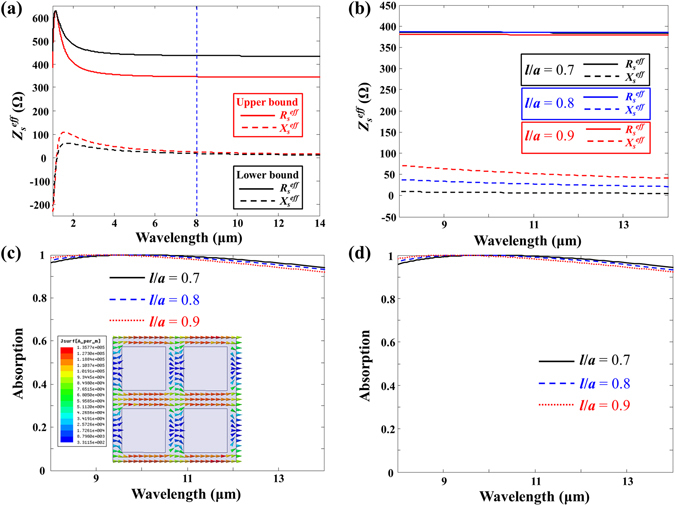
(a) Retrieved effective surface impedances of the metasurfaces for both the upper bound (red curves) and lower bound (black curves) cases. (b) Retrieved effective surface impedances of the metasurfaces for l = 0.7 μm with R s = 128 Ω (black curves), l = 0.8 μm with R s = 83 Ω (blue curves), and 0.9 μm with R s = 40 Ω (red curves). (c) Calculated absorption spectral responses of the metasurface absorbers for l = 0.7 μm with R s = 128 Ω (black curves), l = 0.8 μm with R s = 83 Ω (blue curves), and 0.9 μm with R s = 40 Ω (red curves) with identical vacuum gap distances of d = 2.5 μm. The inset shows the simulated surface current density distribution on the metasurface with l = 0.7 μm at the resonance wavelength. (d) Simulated absorption spectral responses of the metasurface absorbers for l = 0.7 μm with R s = 128 Ω (black curves), l = 0.8 μm with R s = 83 Ω (blue curves), and 0.9 μm with R s = 40 Ω (red curves) with identical vacuum gap distances of d = 2.5 μm.