
Figure 1.
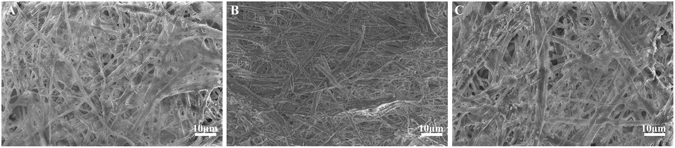
Characterization of acid- and alkali-treated EM. SEM images of EM treated for 72 hours with aqueous solutions of different pH values: (A) pH = 3; (B) DDH2O; and (C) pH = 11 (n = 3).
Official websites use .gov
A
.gov website belongs to an official
government organization in the United States.
Secure .gov websites use HTTPS
A lock (
) or https:// means you've safely
connected to the .gov website. Share sensitive
information only on official, secure websites.
Characterization of acid- and alkali-treated EM. SEM images of EM treated for 72 hours with aqueous solutions of different pH values: (A) pH = 3; (B) DDH2O; and (C) pH = 11 (n = 3).