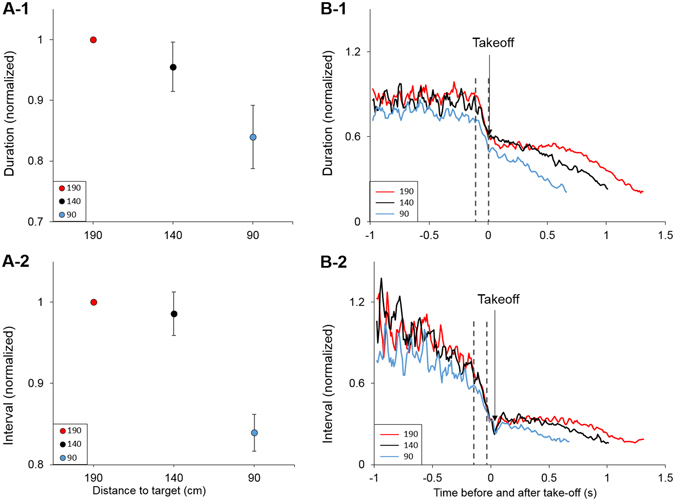
Figure 2.

Bats assess distance to target before takeoff. (A) Echolocation signal duration (A-1) and interval between signal groups (A-2) are significantly shorter immediately before takeoff when the target is closer. Individual one-way ANOVA followed by Tukey’s post-hoc were performed for each individual for which values distribution was normal. For individuals whose values’ distribution was not normal we performed Kruskal-Wallis ANOVA on ranks followed by Dunn’s post-hoc. In all cases differences were significant between 190 cm and 90 cm. 140 cm was not always significantly different from both 90 and 190. For duration: Bat 1: H = 19.29, df = 2, P < 0.001 (N = 96[190 cm], 15[140 cm], 40[90 cm]). Bat 2: F = 6.77, df = 2, P = 0.002 (N = 19[190 cm], 32[140 cm], 32[90 cm]). Bat 3: F = 23.21, df = 2, P < 0.001 (N = 42[190 cm], 23[140 cm], 22[90 cm]). Bat 4: F = 14.75, df = 2, P < 0.001 (N = 118[190 cm], 65[140 cm], 76[90 cm]). For intervals: Bat 1: F = 4.44, df = 2, P = 0.017 (N = 12[190 cm], 6[140 cm], 34[90 cm]). Bat 2: H = 7.94, df = 2, P = 0.019 (N = 10[190 cm], 19[140 cm], 22[90 cm]). Bat 3: F = 7.04, df = 2, P = 0.03 (N = 18[190 cm], 11[140 cm], 12[90 cm]). Bat 4: H = 6.41, df = 2, P = 0.041 (N = 44[190 cm], 29[140 cm], 35[90 cm]). Statistical analyses were performed on raw individual data. Data were normalized for presentation (due to the differences in absolute individual values). We normalized by dividing each bat’s data by its 190 mean value (thus giving the mean at 190 an absolute value of 1 without variation, hence – no error bars). Data shown are the mean ± se for all bats. (B) Signal duration and intervals between signal groups as a function of time before and after takeoff (time point ‘0’). Longer signals and intervals are evident before takeoff and were probably used to assess the distance. Gray dashed lines mark the location in the sequence of the values shown in panels A-1 and 2. At takeoff there was a dramatic drop in these parameters. The mean of all bats is shown. See also Supplementary Figs S3 and S4.
